
Water Observations from Space (WOfS) is a 25-m resolution gridded dataset indicating areas where surface water has been observed over time from 1987 to 2014, calculated using GA satellite data. Each satellite image pixel is an observation; successful observations are those in which the Earth’s surface is clearly seen (unobscured by clouds for example) and quality checks are passed. Water is detected from these observations using an automated flood mapping algorithm created by Geoscience Australia.
The water detected for each location is summed through time and then compared to the number of clear observations of that location (i.e. observations not affected by cloud, shadow or other quality issues). The result is a percentage value of the number of times water was observed at the location. This provides relatively seamless historical water coverage for Australia.
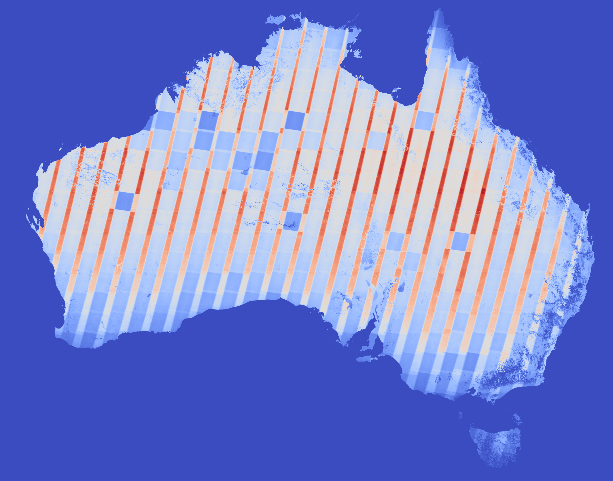
The values in the summary layer indicate how often water was observed (as a proportion of the total number of clear observations) in each cell of a 25 metre by 25 metre grid across Australia since 1987. Possible floods appear in the low values while consistent water bodies such as lakes and dams have high values. The WOfS product Version 1.5 includes observations taken between 1987 and 2014 (inclusive) from the Landsat 5 and 7 satellites. WOfS covers all of mainland Australia and Tasmania but excludes off-shore Territories.
GA maintains documentation on WOfS data online here (PDF). The data archive consists of 2 datasets divided into 1 x 1 degree (latitude and longitude) tiles covering all of Australia:
The individual water extents (Dataset 1) is available in geoTIFF format, while the summary products (Dataset 2) is available via a Web Map Service (see below).
WOfS can be used to map and characterise inland water bodies and provides information about the observed extent of inundation for waterways and floodplains. It is a resource for both users and providers of information about surface water permanence and the extent and frequency of inundation. Potential users include government agencies, research institutions, the general public and academia.
WOfS is limited by the frequency and number of successful observations, which are determined by the satellite revisit rate (see table below) and by clouds. In particular, short-lived inundation events may not have been observed. Areas of inland Australia have been observed over 800 times, whereas highly-cloud-prone coastal and mountainous areas may have very few successful observations.
WOfS is also limited by the quality of the sensors, including their spatial resolution, and the accuracy of the water detection algorithms used. As a consequence of these limitations the product will potentially not detect the flood peak, thereby failing to capture the maximum extent of flooding. This particularly affects rapidly draining coastal catchments where the flood peak often passes before a cloud free observation is acquired.
The latest 2 versions of WOfS can be accessed via http and web services (for the summary layers). Versions are denoted as Current (latest version) and Previous (previous version) and are updated with the latest available data on a quarterly basis.
Norman Mueller is GA’s data mentor for GovHack 2015 - you can contact him with any questions about accessing these services.